A Data Science Story: Data Analysis in Education and the Digital Divide

By Tuly Reyes & Chelsea Prudencio

As promised in our series, “A Data Science Story” this blog will provide insights into data from surrounding villages in Nassau County as it relates to Education and the Digital Divide. The data set was downloaded from the US Census for the following Villages: Rockville Centre, Freeport Village, Garden City, The Village of Hempstead, and Lynbrook.

Step 1: In Data Science terms, we “wrangled” the data. That means, remove blanks, and organize in a structure that we can use. We used Excel, and a nice trick to “transpose” the rows and columns, then saved it as a comma separated values (CSV).

Step 2: Next we need to explore the data. So we will use Google Colab. It is an excellent tool for data exploration and analysis, again in Data Science terms, this is EDA or Exploratory Data Analysis.

During our EDA, we noticed that “computer and internet access” were reported in percentages. And while the percentages looked good all around, we wondered what the impact would look like not in percentages but in terms of individual persons.

Here is our analysis:

Step 1: Data Wrangling

Using the US Census data (estimates for 2019) we wrangled the data and created a Utility Matrix that we will use for the calculations. Since we are focused on the Digital Divide and how it affects education we used the following data fields:

  • Total House Holds
  • Persons Per House Holds
  • Percent of House Holds with Computers
  • Percent of House Holds with Broadband Internet Access

Step 2: EDA & Hypothesis

Lets look at the bar chart as percentages

As you can see there is no dramatics differences exposed in this visualizations. Our hypothesis, or question we asked ourselves was: Would the impact look the same if we converted from percentages to actual numbers?

So we compute the number of Households and the Number of Persons affected by the digital divide in each of these villages. We took the inverse of the percentages for computers and internet access and use them in our computation.

  • Total households without computers = Total Households x (1 – PCT With Computers)
  • Total households without internet = Total Households x (1 – PCT with Internet)
  • Total persons without computers = (Total households without computers) x (Person Per Household)
  • Total persons without internet = (Total Household without internet) x (Persons per Household)

The results are shown by the table below:

Step 3: Conclusion & Impact

By taking the percentages and converting them to numbers show the real impact the “Digital Divide” has on communities in our area. Sometimes showing impact a as percentage does not bring to light the seriousness of the problem. In the case of Hempstead we can see that the access to computers and internet affects 5,010 + 10,891. A total of over 15,000 persons are impacted by the digital divide.

Now let’s take a look at the visualization and not percentages but as actual persons affected.

The results are obvious. The digital divide impact is now clear between villages in our select data sets. As aspiring data scientist, we are anomaly spotters and we let the data speak for itself.

I Just Want To Learn

Knowledge is understanding gained through learning or experience. You read a recipe to gain knowledge about baking rhubarb pie. When it burns in the oven, experience gives you the knowledge that you need to stop doing three things at once. Fields like biology, math, art, medicine, and others have huge bodies of knowledge. Knowledge can mean information and also deeper understanding. You can use this word as a disclaimer too, as in “To my knowledge, my sister walked the dog.” – source https://www.vocabulary.com/dictionary/knowledge

Learning leads to awareness but the most important thing is the knowledge that we gain. The definition of knowledge above, can be summarized this way. Awareness.

Today we have a very advanced technology at our finger tips. If we need some type of information we can quickly find it online. We also have the ability to read, communicate, ask, and above all discover to do something new every day.

I want to learn because …

I want to be a person full of knowledge. I want to continue learning until I can’t no more! I want to able to help other people and to continue sharpening my reasoning and problem solving skills. Thanks to Dr. Steven Lindo for his teachings, for motivating us and, for being a fantastic person. Make the most out of your summer and learn!

By Tuly Reyes

Why STEM Matters

Science Technology Engineering & Math (STEM) Impact on Jobs

June 25, 2018 – SpringBoard Team

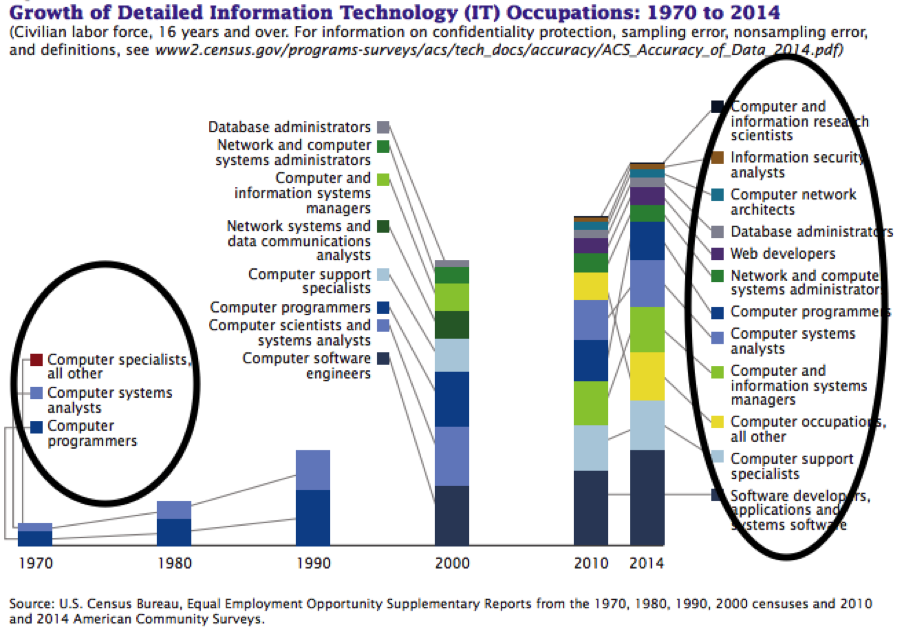
Since the information technology (IT) boom in the 1990’s IT workers more than doubled between 1990 and 2000. The chart below from the U.S. Census shows the growth since 1970 and the diversity of jobs that are available to IT professionals.

From the chart above we can see that many different skill sets and job functions have been created from 1970 to 2014. The chart shows 3 categories in 1970 and 14 different categories in 2014. The industry has continued to grow and evolve from 2015 to 2018 and Big Data problems have given birth to a new set of job skills: Data Scientists, and Cloud Architects. Some of the key skills that Data Scientists possess include Python Programming, Statistical Analysis and Machine Learning.

STEM Impact on Salaries

As the information technology industry continues to evolve into 2020, new skill sets will be required to meet the demands of this expansion. Information Technology continues to be one of the highest paying professions in the U.S. The information provided by the United State Department of Labor – Bureau of Labor Statistics shows the potential earnings for computer and information technology professionals by industry.

Industry Employment Percent of industry employment Hourly mean wage Annual mean wage
Computer Systems Design and Related Services

79,100

4.01 $73.80 $153,510
Management of Companies & Enterprises 36,540 1.59 $71.24 $148,180
Management, Scientific, and Technical Consulting

Services

15,160 1.14 $72.65 $151,110
Insurance Carriers 12,300 1.05 $70.88 $147,430
Colleges, Universities, and Professional Schools 11,600 0.39 $54.65 $113,660